DPD80 User Manual
Note
Not all USB Type-C cables support USB 3.1 transfer rates. Ensure you are using a cable rated for USB 3.1 Gen 1 (previously called USB 3.0) communication, such as the cable supplied with the detector. If a cable rated for USB 3.1 Gen 1 is not used, data streaming will be disabled.
USB 2.0 rated Type-C cables can still be used for powering the detector and simple control, such as toggling the anti-aliasing filter. However, digital data streaming will be disabled.
Handling Precautions
Warning
Avoid electrostatic discharges by grounding yourself before handing the DPD80 USB Photodetector.
Do not exceed the absolute maximum ratings for input power and I/O voltages. These values for each version of the DPD80 USB Photodetector are found on its datasheet.
For free space versions, avoid scratching the photodiode. For fiber coupled versions, make sure that any connector inserted into the FC/APC port is clean and cover the FC/APC port when it is not in use.
DPD80 Functional Diagram

Analog Operation
The DPD80 USB Photodetector has an SMA output (50 Ohm) providing an 80 kV/A transimpedance amplification of the photodiode current. The SMA output on the DPD80 USB Photodetector is DC coupled and outputs 0 - 3.1 V, proportional to the photodiode current and optical power incident on the photodiode. For calibration from voltage to power, see the Certificate of Calibration provided with your DPD80, or use the ri_get_calibration() or ripy.Device.get_calibration() functions to retrieve the calibration stored on the EEPROM within your DPD80.
The analog output is enabled whenever the DPD80 is powered by a USB source, and by default operates in the DPD80’s high-gain mode. The analog output can be switched to the DPD80’s low-gain mode, however requires being connected to a PC with driver software to switch modes after power on.
Digital Operation
The full power of the DPD80 USB Photodetector comes from it’s built-in digitization circuitry. The DPD80 features low-noise amplifiers and an anti-aliasing filter carefully matched to it’s on-board 80 MSPS, 14 bit analog-to-digital converter (ADC). The DPD80 is capable of streaming these samples in real-time to the host PC over USB 3.1 where today’s fast processors are able to analyze the data stream in a completely configurable way.
For instance, the measured signal can be spectrally analyzed with a Fourier transform to calculate the signal’s power spectral density (PSD). With an 80 MSPS sample rate, the Nyquist theorem says we can capture signals with frequencies up to 40 MHz. For lowest noise operation, the digital signal path includes a 35 MHz, 5 pole antialiasing filter to condition the signal before sampling. This filter can be bypassed to enable subsampling of higher frequency signals of rates up to the full analog bandwidth of 100 MHz.
For computational efficiency, the 14 bit samples captured by the ADC are packed into the lower 14 bits of 16 bit unsigned integers and sent to the computer. The upper 2 bits of the 16 bit samples measure the 3.3 V logical signals applied to the S (Sync) and T (Trig) MMCX ports on the DPD80. These can be used as to be used, for example, as synchronization or triggering signals.
Currently the DPD80 is only supported on Windows 7 (and later) operating systems. Windows 10 is recommended for best performance.
Anti-aliasing Filter
The 35 MHz anti-aliasing filter, seen in DPD80 Functional Diagram, is a 5-pole low pass filter (LPF) that can be either enabled (the default) or bypassed. By using the anti-aliasing filter, higher frequency noise above the digital sampling bandwidth is sharply reduced. However, by bypassing the anti-aliasing filter it allows signals from 40 MHz to 100 MHz to be mapped into the first Nyquist zone when Fourier transformed. The anti-aliasing filter does not affect the analog output and it can be controlled with either the user interface pteroDAQtyl, or the software libraries such as ripy with the ripy.Device.antialias property.
Gain Modes
The DPD80 USB Photodetector has two gain modes, high (default) and low, that differ by a factor of 4. This gain selection is implemented at the transimpedance amplifier so it affects both the data collected by the internal ADC and the signal at the analog output. The high gain mode has approximately half the minimum noise equivalent power (NEP) as the low gain mode, however using the low gain mode increases the saturation power by a factor of 4. Like the anti-aliasing filter, the gain mode can be controlled with either the user interface pteroDAQtyl, or the software libraries such as with the ripy.Device.highgain property.
Calibration
Each DPD80 USB Photodetector is individually calibrated before being shipped to ensure accurate conversions from ADC code and output voltage to input power. The calibrations can be found on either the Certificate of Calibration provided with your DPD80, or by using the ri_get_calibration() or ripy.Device.get_calibration() functions to retrieve the calibration which is stored on the EEPROM within your DPD80. Using C, Python, or MATLAB, data can be collected from the built-in ADC in either a 14-bit ADC code (for computational efficiency) or as a floating-point calibrated optical power.
Note
Calibration values return optical power assuming the input light is at the peak wavelength sensitivity of the photodiode. If input light is not at these peak wavelengths, the ri_get_rel_responsivity() or ripy.Device.get_rel_responsivity() functions can be used to find the relative responsivity of the photodiode to off-peak wavelengths.
DPD80 Ports
The DPD80 has 4 MMCX connectors on the back labelled A, B, S, and T. These connectors are referred to as ports and offer additional functionality to the DPD80. All of the ports are connected to an internal microcontroller inside the DPD80 and communicate with 3.3 V logic levels.
Modes of Operation
There are five different modes the ports can be configured in:
- Digital Out
The port can be configured through software to drive a 3.3 V logic signal.
- Digital In
The port can be queried in software to read the 3.3 V logic signal applied to the port.
- PWM
Pulse Width Modulation output. The port is configured to output a square wave between 0 and 3.3 V with a given period and duty cycle. This is configured by providing a period for the wave, and a threshold - the length of time the square wave is high. These are specified in clock cycles, corresponding to about 5 ns per clock cycle.
- Pulse Now
Similar to the PWM mode, however not repeating. The port is immediately set high for the number of clock cycles (~5 ns) given as the threshold and returned to low afterwards. Due to internal restrictions, the smallest pulse that can be made is 2 clock cycles long, or ~10 ns.
- Stream In
In stream in mode, the ports are sampled simultaneous to the digitized samples and stored in the unused bits of the 16 bit ADC samples. Only ports S and T are compatible with this mode.
Ports
The ports offer generally similar functionality, with a few differences that distinguish them fron one another.
- Port A
The Analog port. This port has a 4 pole ~1 kHz low-pass filter on it’s output. This is designed so by using PWM this port can act as 11 bit analog output port. Because of this low-pass filter the port has a settling time of approximately 1 ms.
- Port B
The Binary port. This port is similar to port A, but without a lowpass filter. This is the general purpose binary input output port.
- Port S
The Sync port. This port is connected such that it is sampled with the ADC at 80 MSPS as the 15th bit in the 16 bit ADC sample. Currently this port can only be configured as a Stream In port.
- Port T
The Sync port. This port is connected such that it is sampled with the ADC at 80 MSPS as the 16th bit in the 16 bit ADC sample. Currently this port can only be configured as a Stream In port.
Note
On the DPD80 Balanced Photodetectors, Port S and Port T are configured as analog power monitor outputs for the individual photodiode signals. To reconfigure ports S and T and trigger/sync ports, use the libri ri_set_p1_select() and ri_set_p2_select() functions, or with Python, the p1_select and p2_select properties of a ripy.Device.
Driver Installation
In order to use the DPD80 USB Photodetector with Windows, appropriate drivers must first be installed. Please visit the downloads page to download the .msi installer for the RICU3 drivers.
When no drivers are installed, the DPD80 should show up in the Device Manager under Other devices. Once the RICU3 drivers are installed, a connected DPD80 will show up under Universal Serial Bus devices (Windows 10), or on Windows 7, under Universal Serial Bus controllers.
Manual Driver Installation
Driver Installation
If you are unable to install the RICU3 drivers with the installer, the drivers can be installed manually.
Download and unzip the Resolved Instruments RICU3 Driver for DPD80 - zip
Open Device Manager by searching for it from the Windows start menu
Plug in a DPD80 to the computer. It should show up under Other Devices as DPD80
Right click DPD80 and choose Update Driver Software…
Choose Browse my computer for driver software
Browse to the location where the drivers where unzipped to and choose the folder that matches your version of Windows
If prompted for permission to install the device software, choose Install.
The drivers should be installed. The DPD80 should show up as Resolved Instruments DPD80 Photodetector under the Universal Serial Bus controllers section. If it does not, try replugging in the DPD80 or restarting Windows.
Driver Uninstallation
Open Device Manager
Ensure a DPD80 is connected and find Resolved Instruments DPD80 Photodetector under the Universal Serial Bus controllers section.
Right click Resolved Instruments DPD80 Photodetector and choose Uninstall
Important - check Delete the driver software for this device
Click OK. The drivers will be uninstalled.
Interfacing with the DPD80 USB Photodetector
Resolved Instruments provides several methods of controlling the DPD80 USB Photodetector. These include the C library libri, the Python module ripy, the user interface pteroDAQtyl, and the Resolved Instruments MATLAB toolbox.
pteroDAQtyl Overview
pteroDAQtyl is a user interface for real-time visualization and control of the DPD80 USB Photodetector. This software is provided for free and is available from the Resolved Instrument’s website at downloads page.
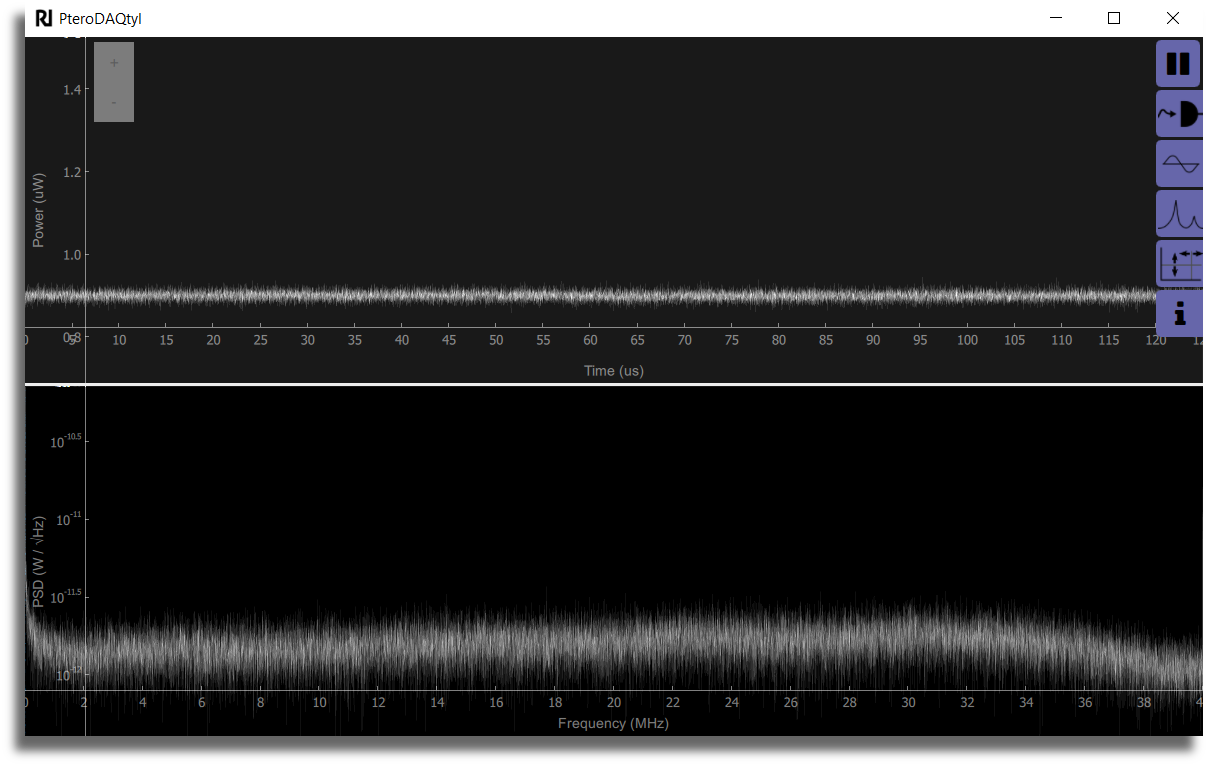
The top half of the program is an oscilloscope view for visualizing the incoming data in the time domain. The bottom half is a power spectrum obtained via fast Fourier transform (FFT) of the incoming data. The various settings of pteroDAQtyl and the DPD80 USB Photodetector can be controlled using the tabs on the right hand side of the program.
A brief explanation of each tab and settings that can be controlled in each one is provided here:
- Play Tab
Allows data collection to be started and stopped and indicates if the DPD80 USB Photodetector is disconnected
- Settings Tab
Select and connect to your DPD80 USB Photodetector.
Control gain mode and anti-aliasing filter.
Select the wavelength that is incident on your DPD80. This will adjust the calibration to compensate for the spectral responsivity of the photodiode.
Select the sample rate. The maximum sample rate of the DPD80 is 80 MSPS, but lower sample rates can be selected. This is particularly useful when viewing signals below 1 MHz as it greatly reduces the amount of memory that is stored on your PC.
Select a digital filter. A digital filter should be used when selecting a reduced sample rate to prevent aliasing.
Control ports A, B, S & T
Save the direct input buffer. The direct input buffer is an uninterupted stream of data which can be used to save very large arrays of data that are not segmented into seperate oscilloscope sweeps.
- Oscilloscope View Tab
Control the amount of data collected during each sweep. This can be done by either adjusting the number of samples collected or the time to collect data.
Enable and control the trigger source. The data collection can be triggered on the level of the incoming signal using the cursor. Additionally it can be triggered by the S & T ports.
Save the data in the oscilloscope view. This will all the oscilloscope sweeps that are currently being displayed.
- Spectrum View Tab
Control the amount of data collected during each FFT. This can be done by adjusting the number of samples collected, the time to collect data or the resolution bandwidth.
Control the number of Fourier transforms to average.
Save the FFTs. This can also be used to save the numerous previous spectrums stored in memory.
- Cursor Tab
Control cursors on the oscilloscope view and the spectrum view.
- Info Tab
pteroDAQtyl version number, copyright and licences for pteroDAQtyl’s opensource dependencies.
pteroDAQtyl is continually being updated to provide new features. If there is a feature that would be useful for your application we would like to hear from you. Please send us an email at info@resolvedinstruments.com.
Python Module
For general data collection with DPD80 USB Photodetector, we recommend using the Python module ripy together with a Jupyter notebook. Please see the ripy documentation for more information on using ripy.
MATLAB Toolbox
To control the DPD80 using MATLAB, you can do so using our MATLAB toolbox. For more information please visit our MATLAB documentation
C library
For more advanced use, and peak computational performance, the C library libri can be used. To get started, see the libri Introduction, and try out the examples provided with the libri release on the downloads.