ripy Basic Example
Download this example
This example collects and plots data from the DPD80.
[2]:
%pylab inline
import ripy
Populating the interactive namespace from numpy and matplotlib
[3]:
# Opens a ripy device that is connected to your computer
d = ripy.Device()
# To open a specific device, with your device's serial number.
# d = ripy.Device(serial="XXXX-XXXX-XX")
[4]:
# Turn on high gain mode and the antialiasing filter
d.highgain = True
d.antialias = True
[8]:
nsamples = int(1e5)
# use the built-in calibration to calibrate the samples to uW
# at the device's peak responsivity
data_uW = d.get_calibrated_data(nsamples)
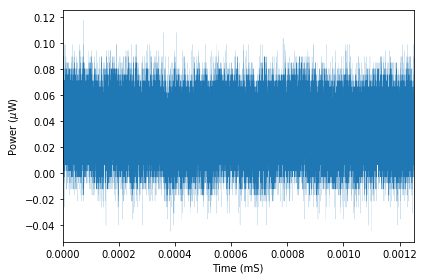
[9]:
time_ms = arange(nsamples) / d.samplerate

figure(figsize = (6,4))
plot(time_ms, data_uW, linewidth = 0.1)
xlabel("Time (mS)")
ylabel("Power ($\mu$W)")
xlim(time_ms[0], time_ms[-1])
tight_layout()